V1 - Examples - Time Series
Apart from the basic statistics of variables, how they change with time is another important thing we care about. From the time series of a variable, potentially anomalous activitis can be found.
The time series is carried out by the command timechart.
function aws_Region_timechart()
    search {from="-7d@d", to="@d"} sContent("@event_type","@cloudtrail")
    let {awsRegion} =f("@cloudtrail")
    let timestamp=f("@timestamp")
    timechart {span="1h"} count_Region_timechart=count() by awsRegion
end
function aws_eventName_timechart()
    search {from="-7d@d", to="@d"} sContent("@event_type","@cloudtrail")
    let {eventName} =f("@cloudtrail")
    let timestamp=f("@timestamp")
    timechart {span="1h"} count_eventName_timechart=count() by eventName
end
function aws_eventType_timechart()
    search {from="-7d@d", to="@d"} sContent("@event_type","@cloudtrail")
    let {eventType} =f("@cloudtrail")
    let timestamp=f("@timestamp")
    timechart {span="1h"} count_eventType_timechart=count() by eventType
end
stream aws_Region_timechart=aws_Region_timechart()
stream aws_eventName_timechart=aws_eventName_timechart()
stream aws_eventType_timechart=aws_eventType_timechart()
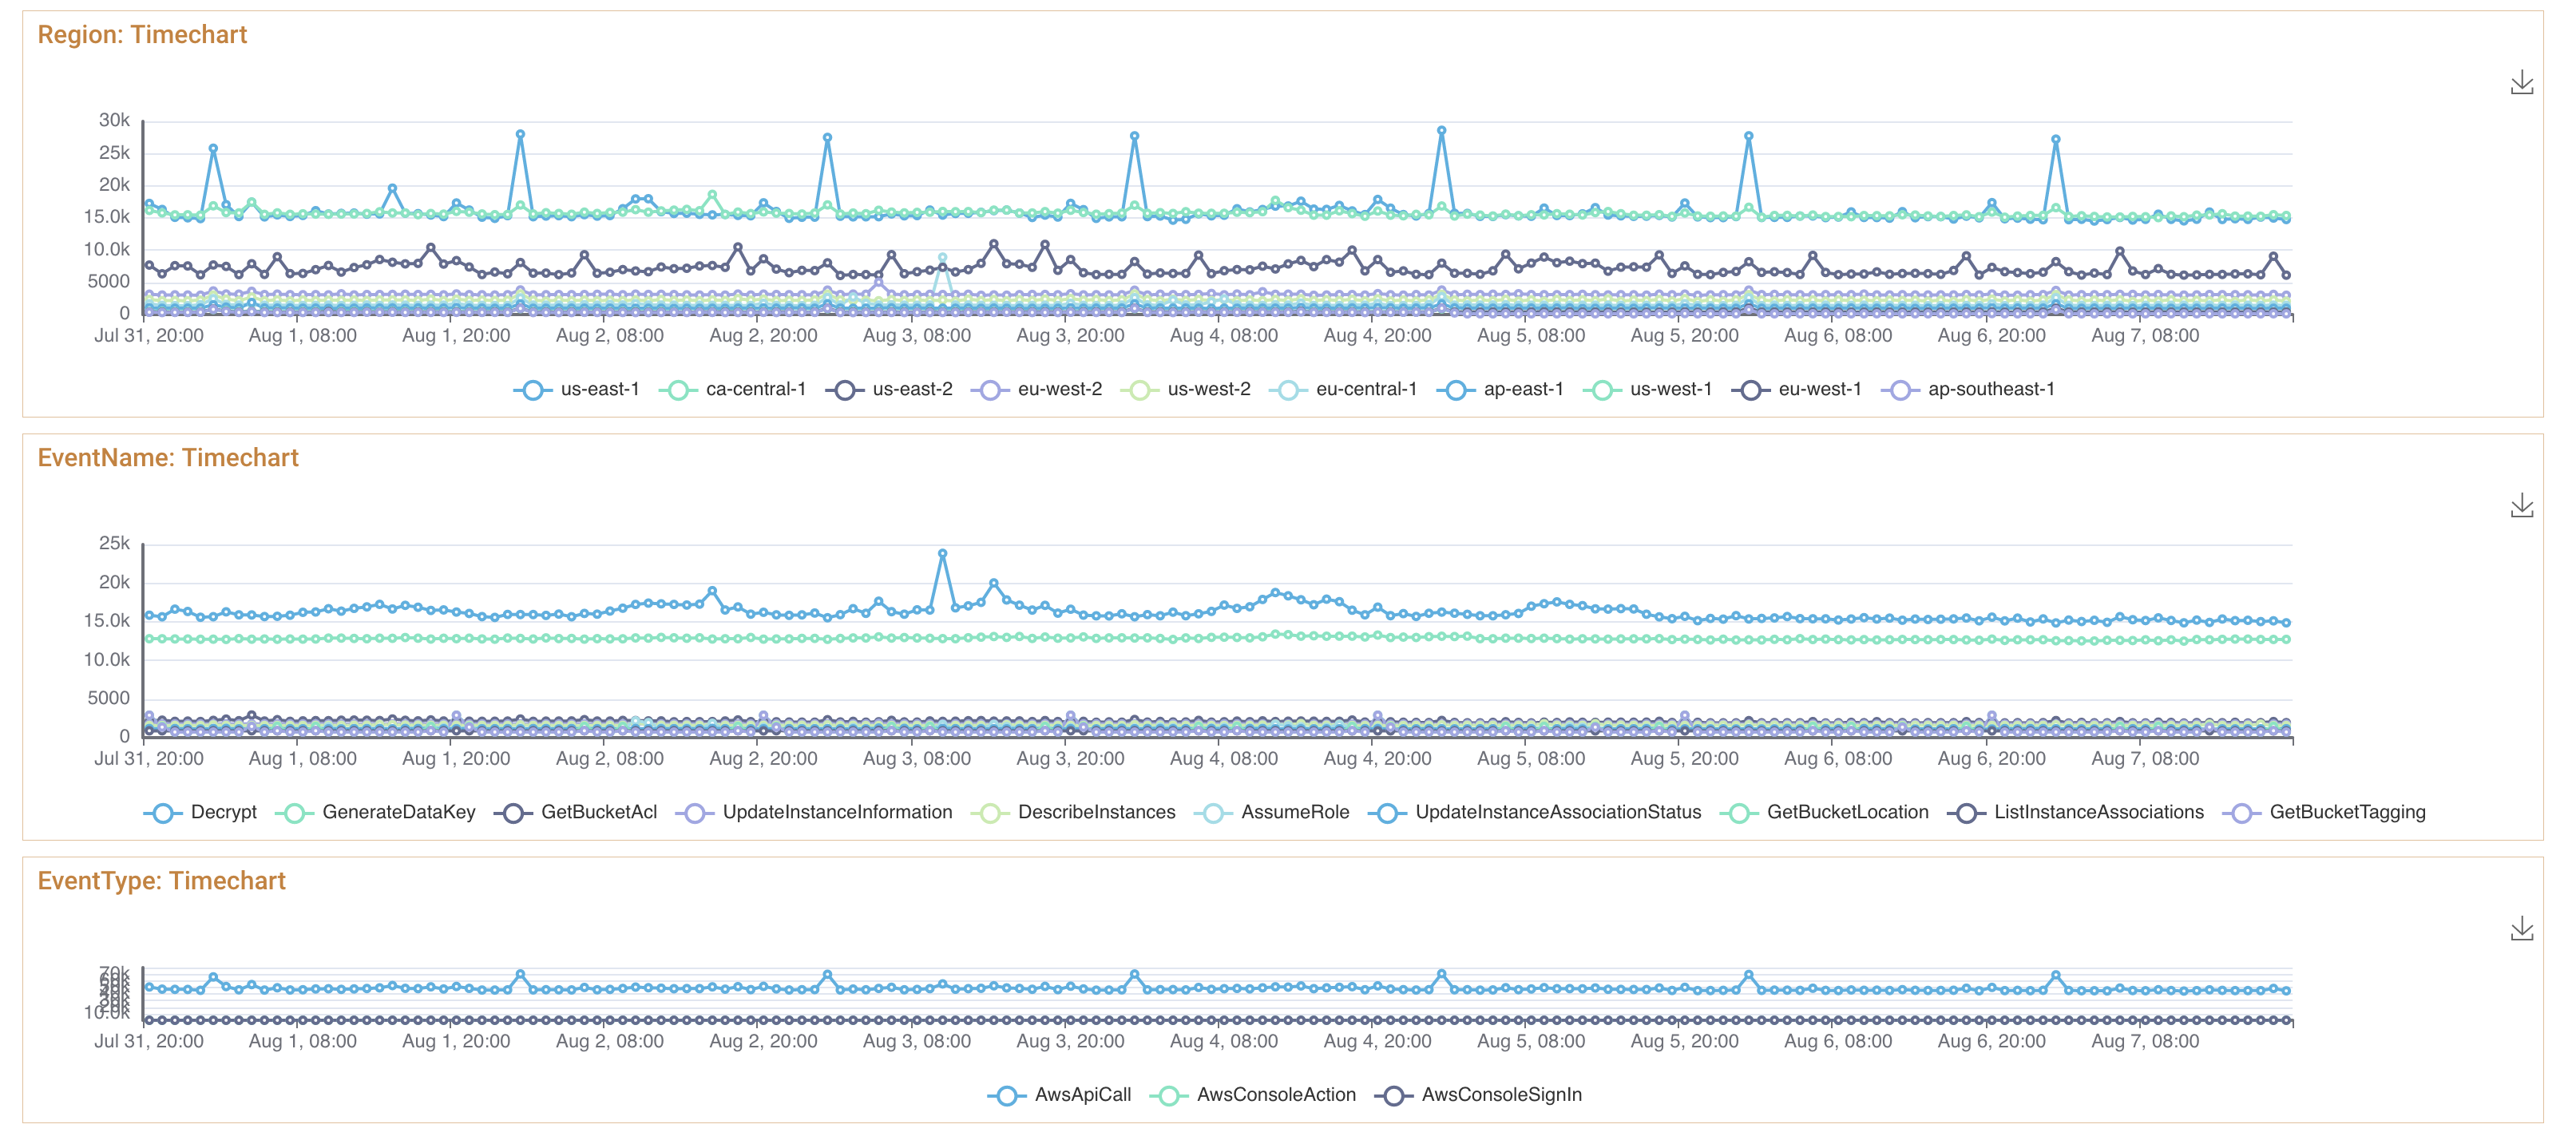
In this example, the time series of region, event name and type are given.